Finance Overview
E-commerce, Dashboard

Challenge
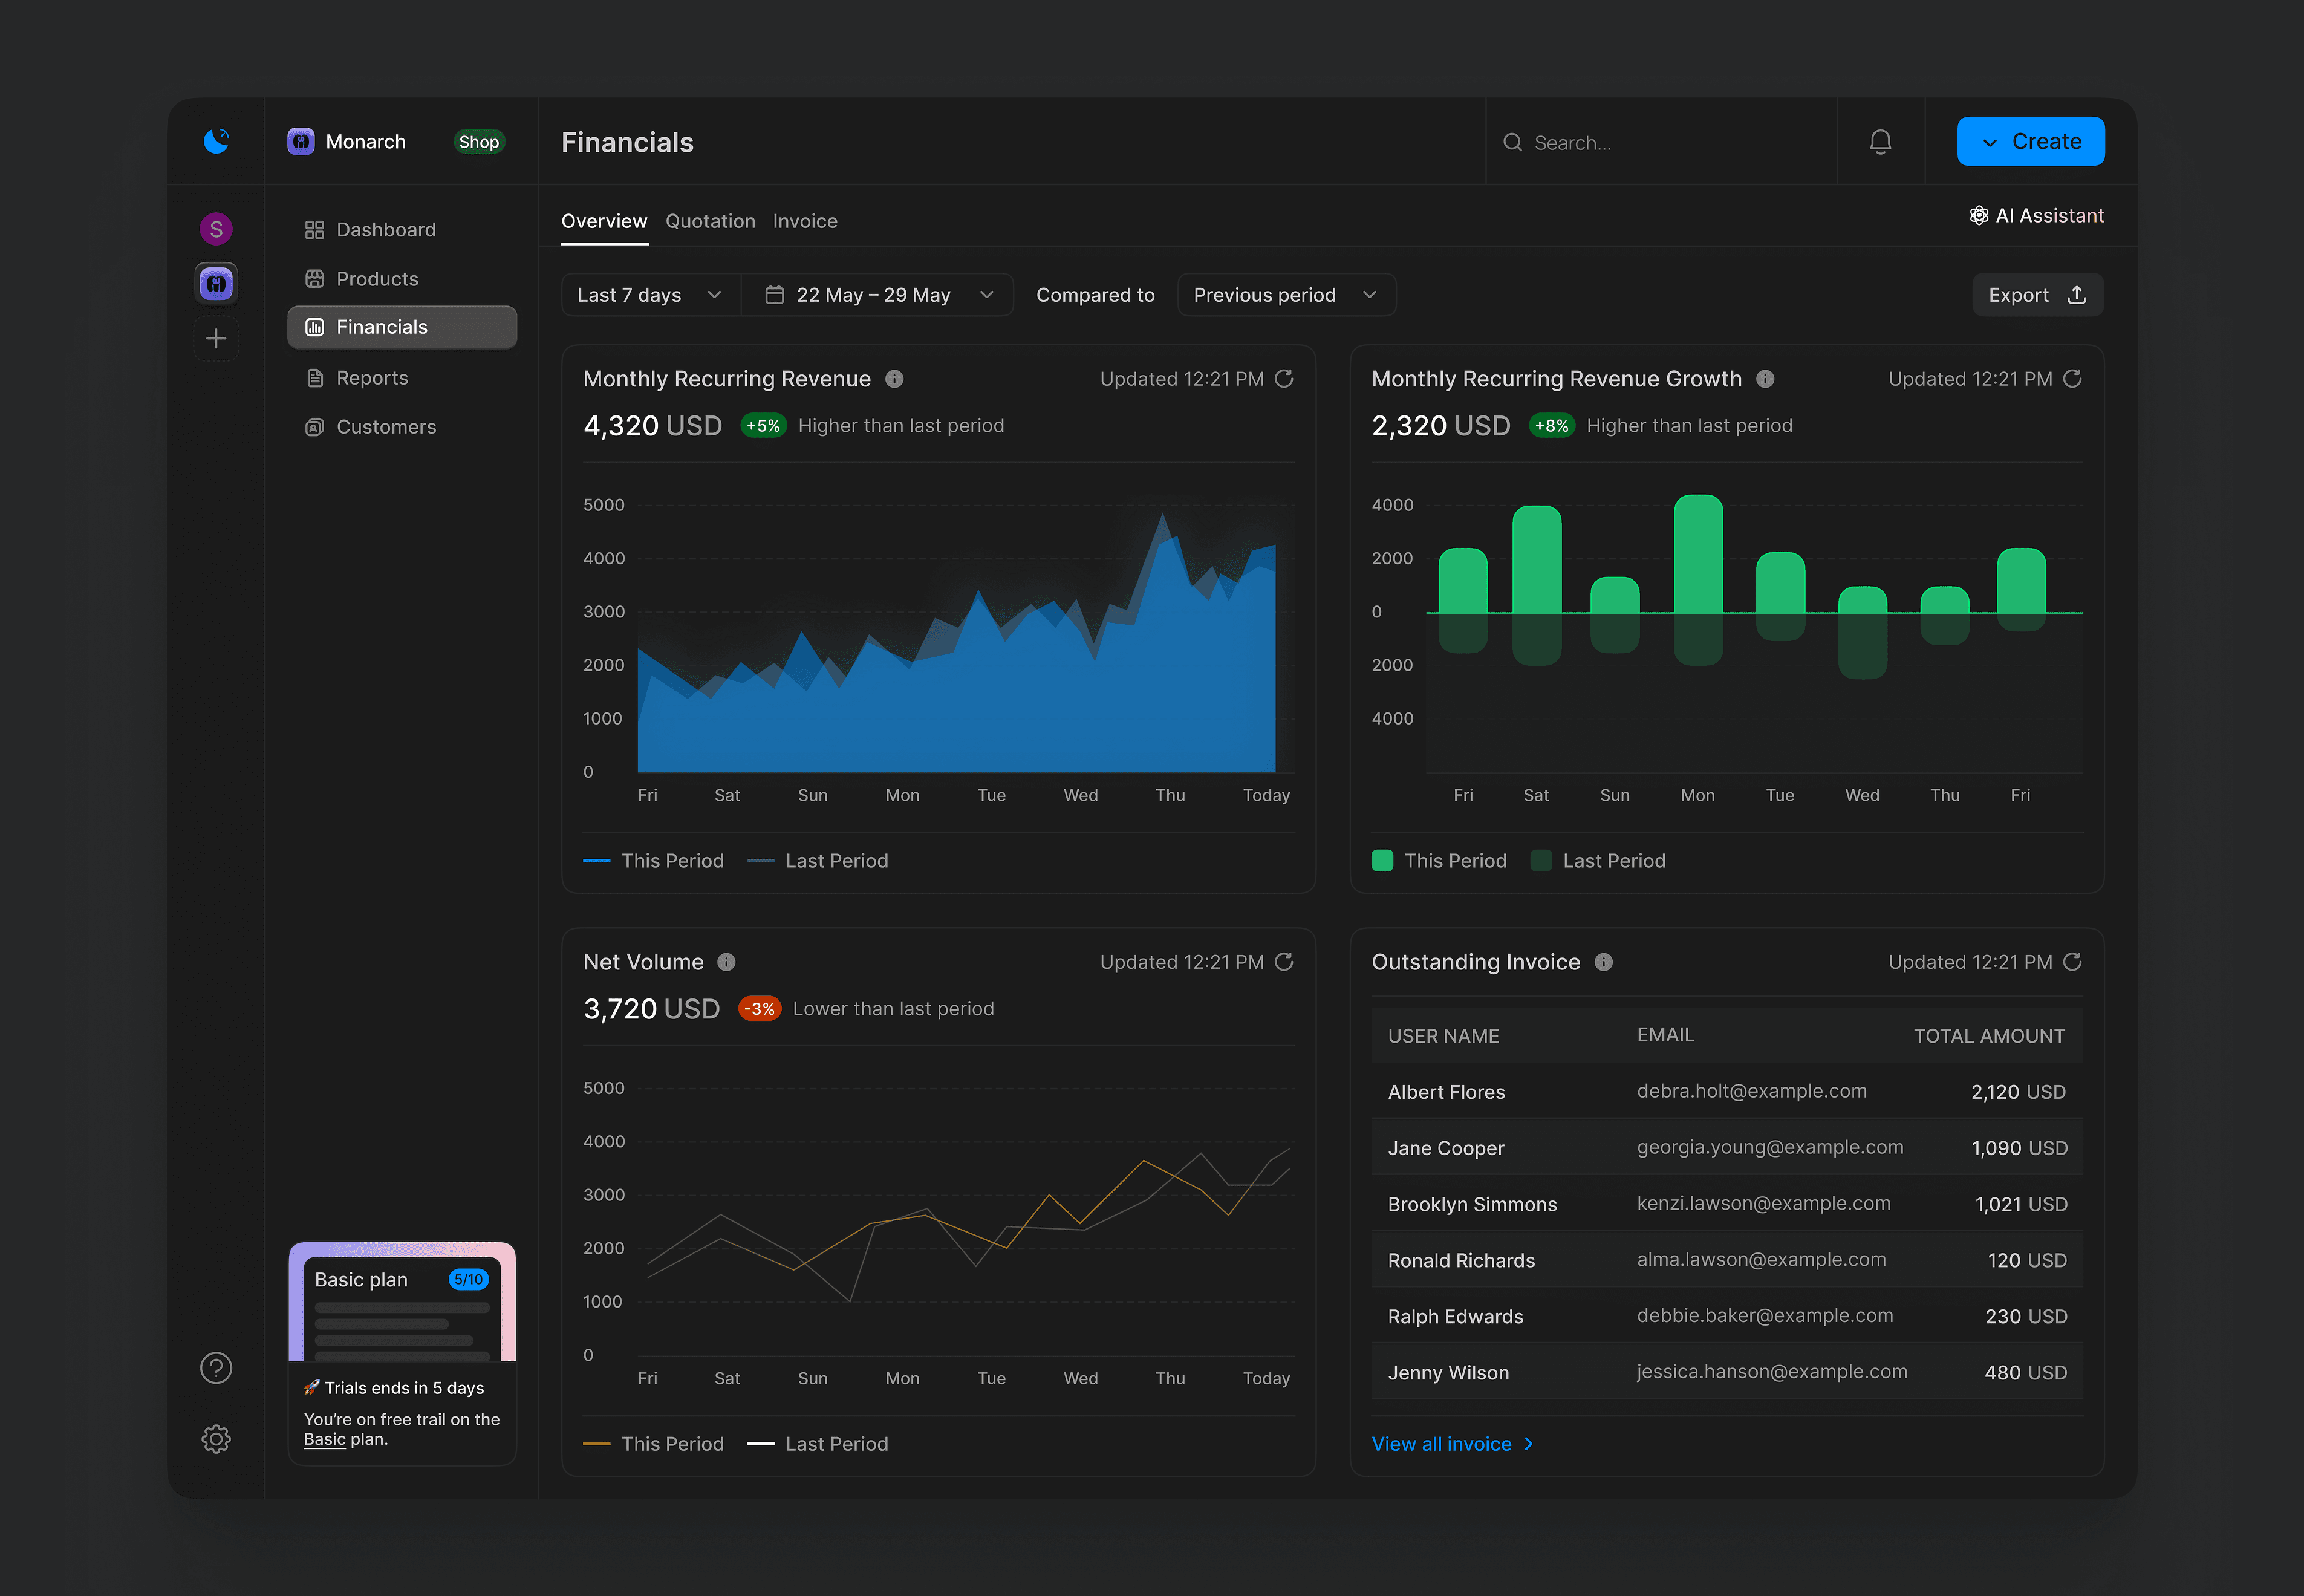
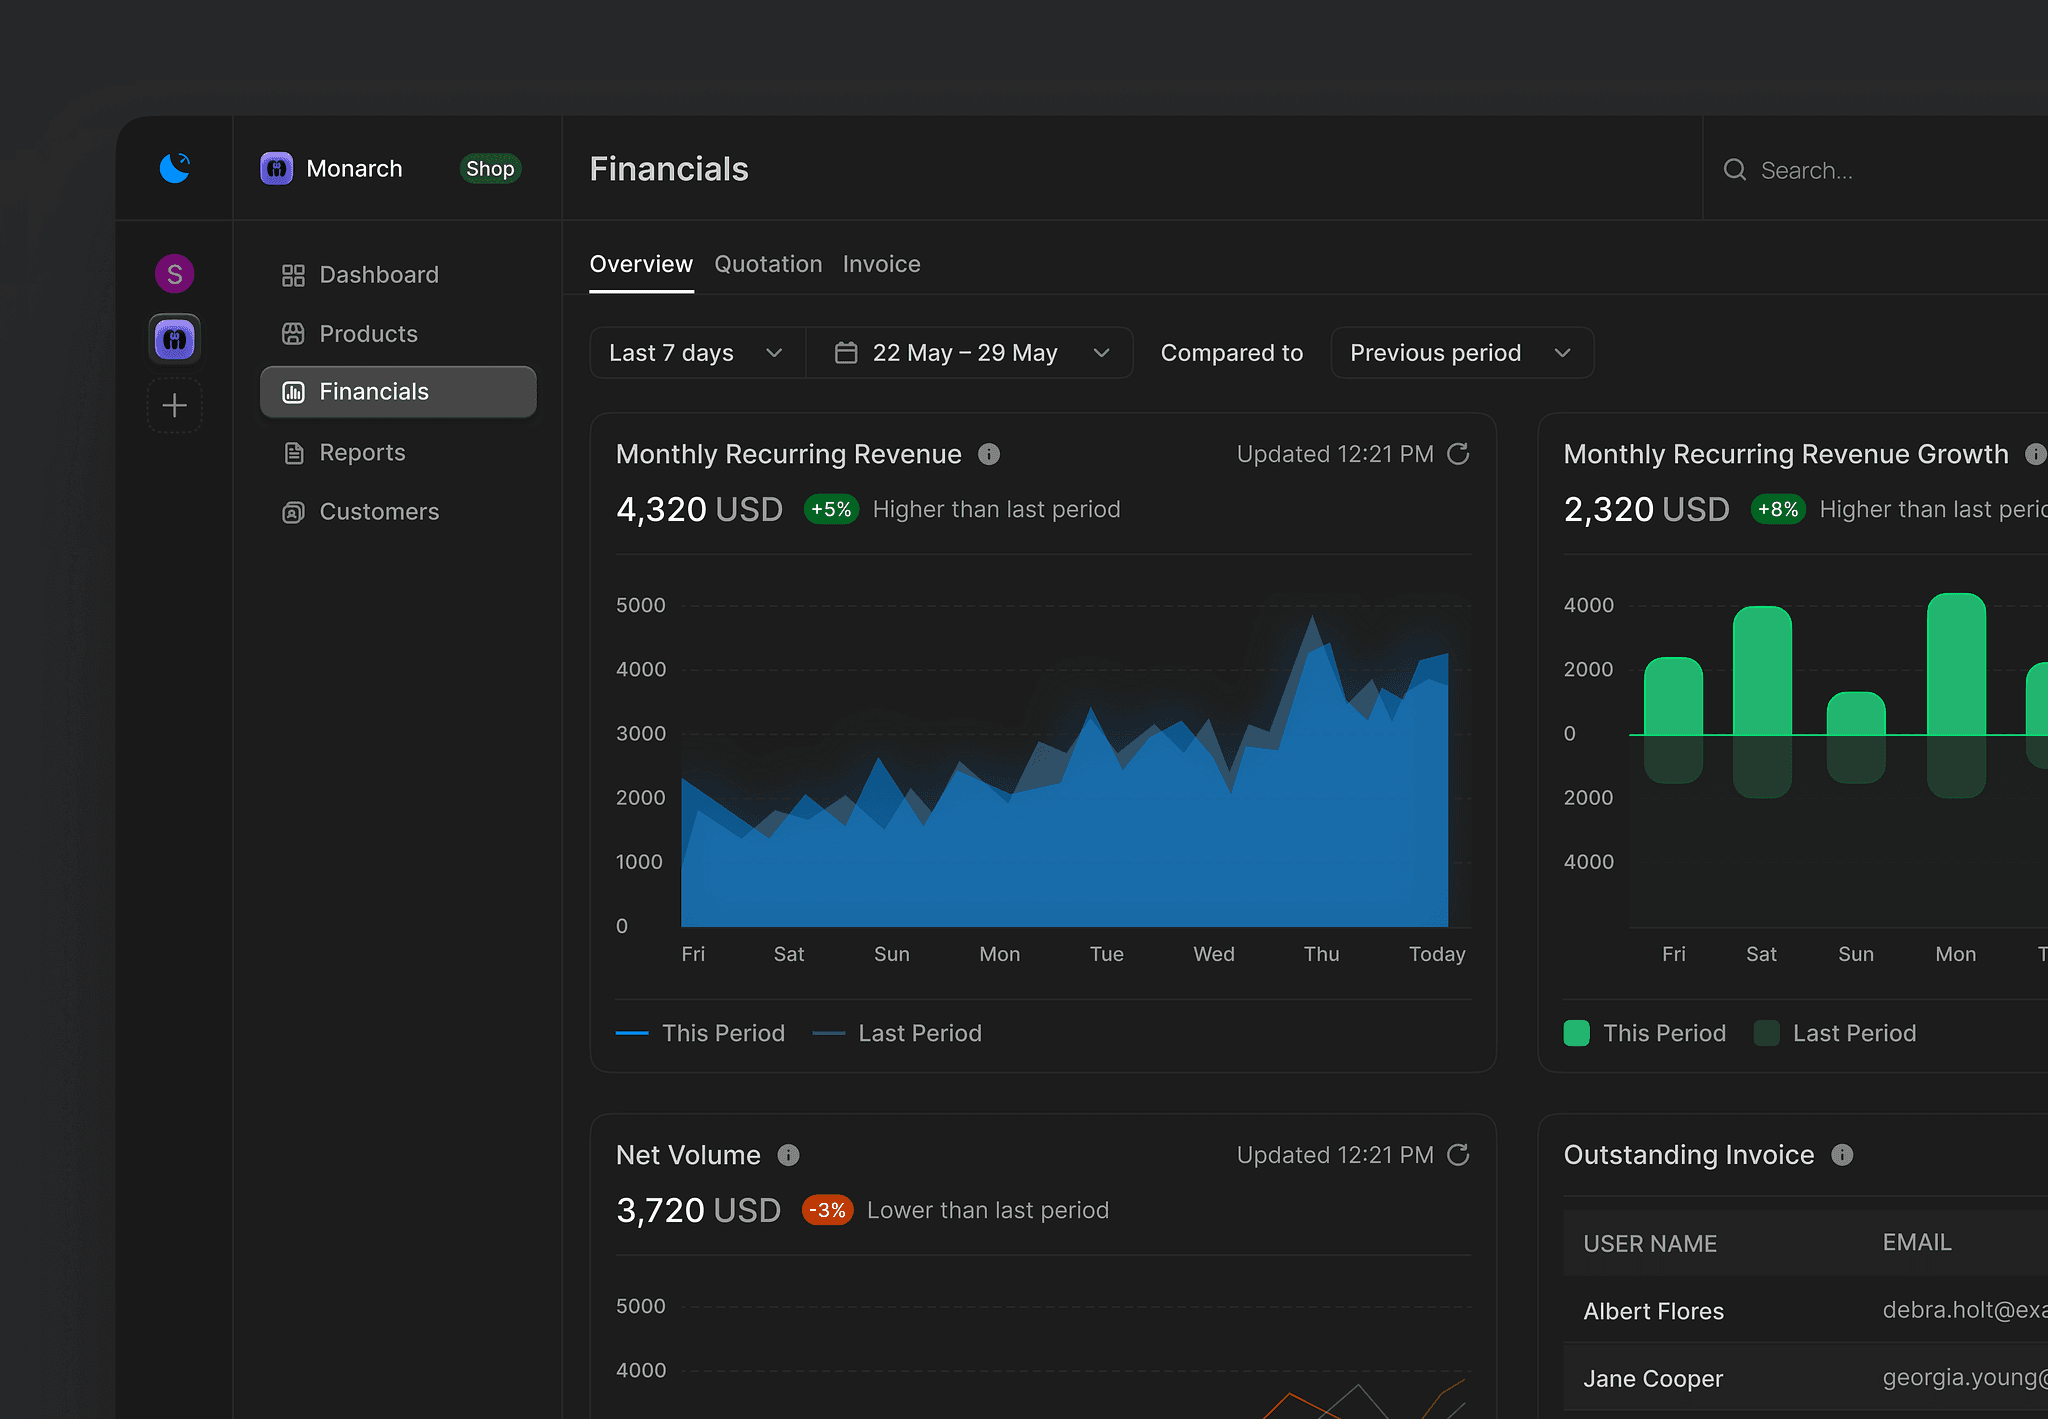
Build a single, fast dashboard that gives finance teams a clear, actionable view of revenue health (MRR + growth), net volume trends, and outstanding invoices; the existing experience buried insights, made comparisons hard, and slowed decisions.
Research & insights
- Personal project, no stakeholder interviews. I ran a competitive review, heuristic evaluation, and quick prototype tests with peers to validate assumptions.
- Core needs identified: track MRR and growth, spot Net Volume shifts, and quickly act on overdue invoices.
- Pain points: fragmented data, slow filters, and missing invoice context for follow-up. Users (from quick tests) wanted fast period comparisons and direct drill-downs.
Solution
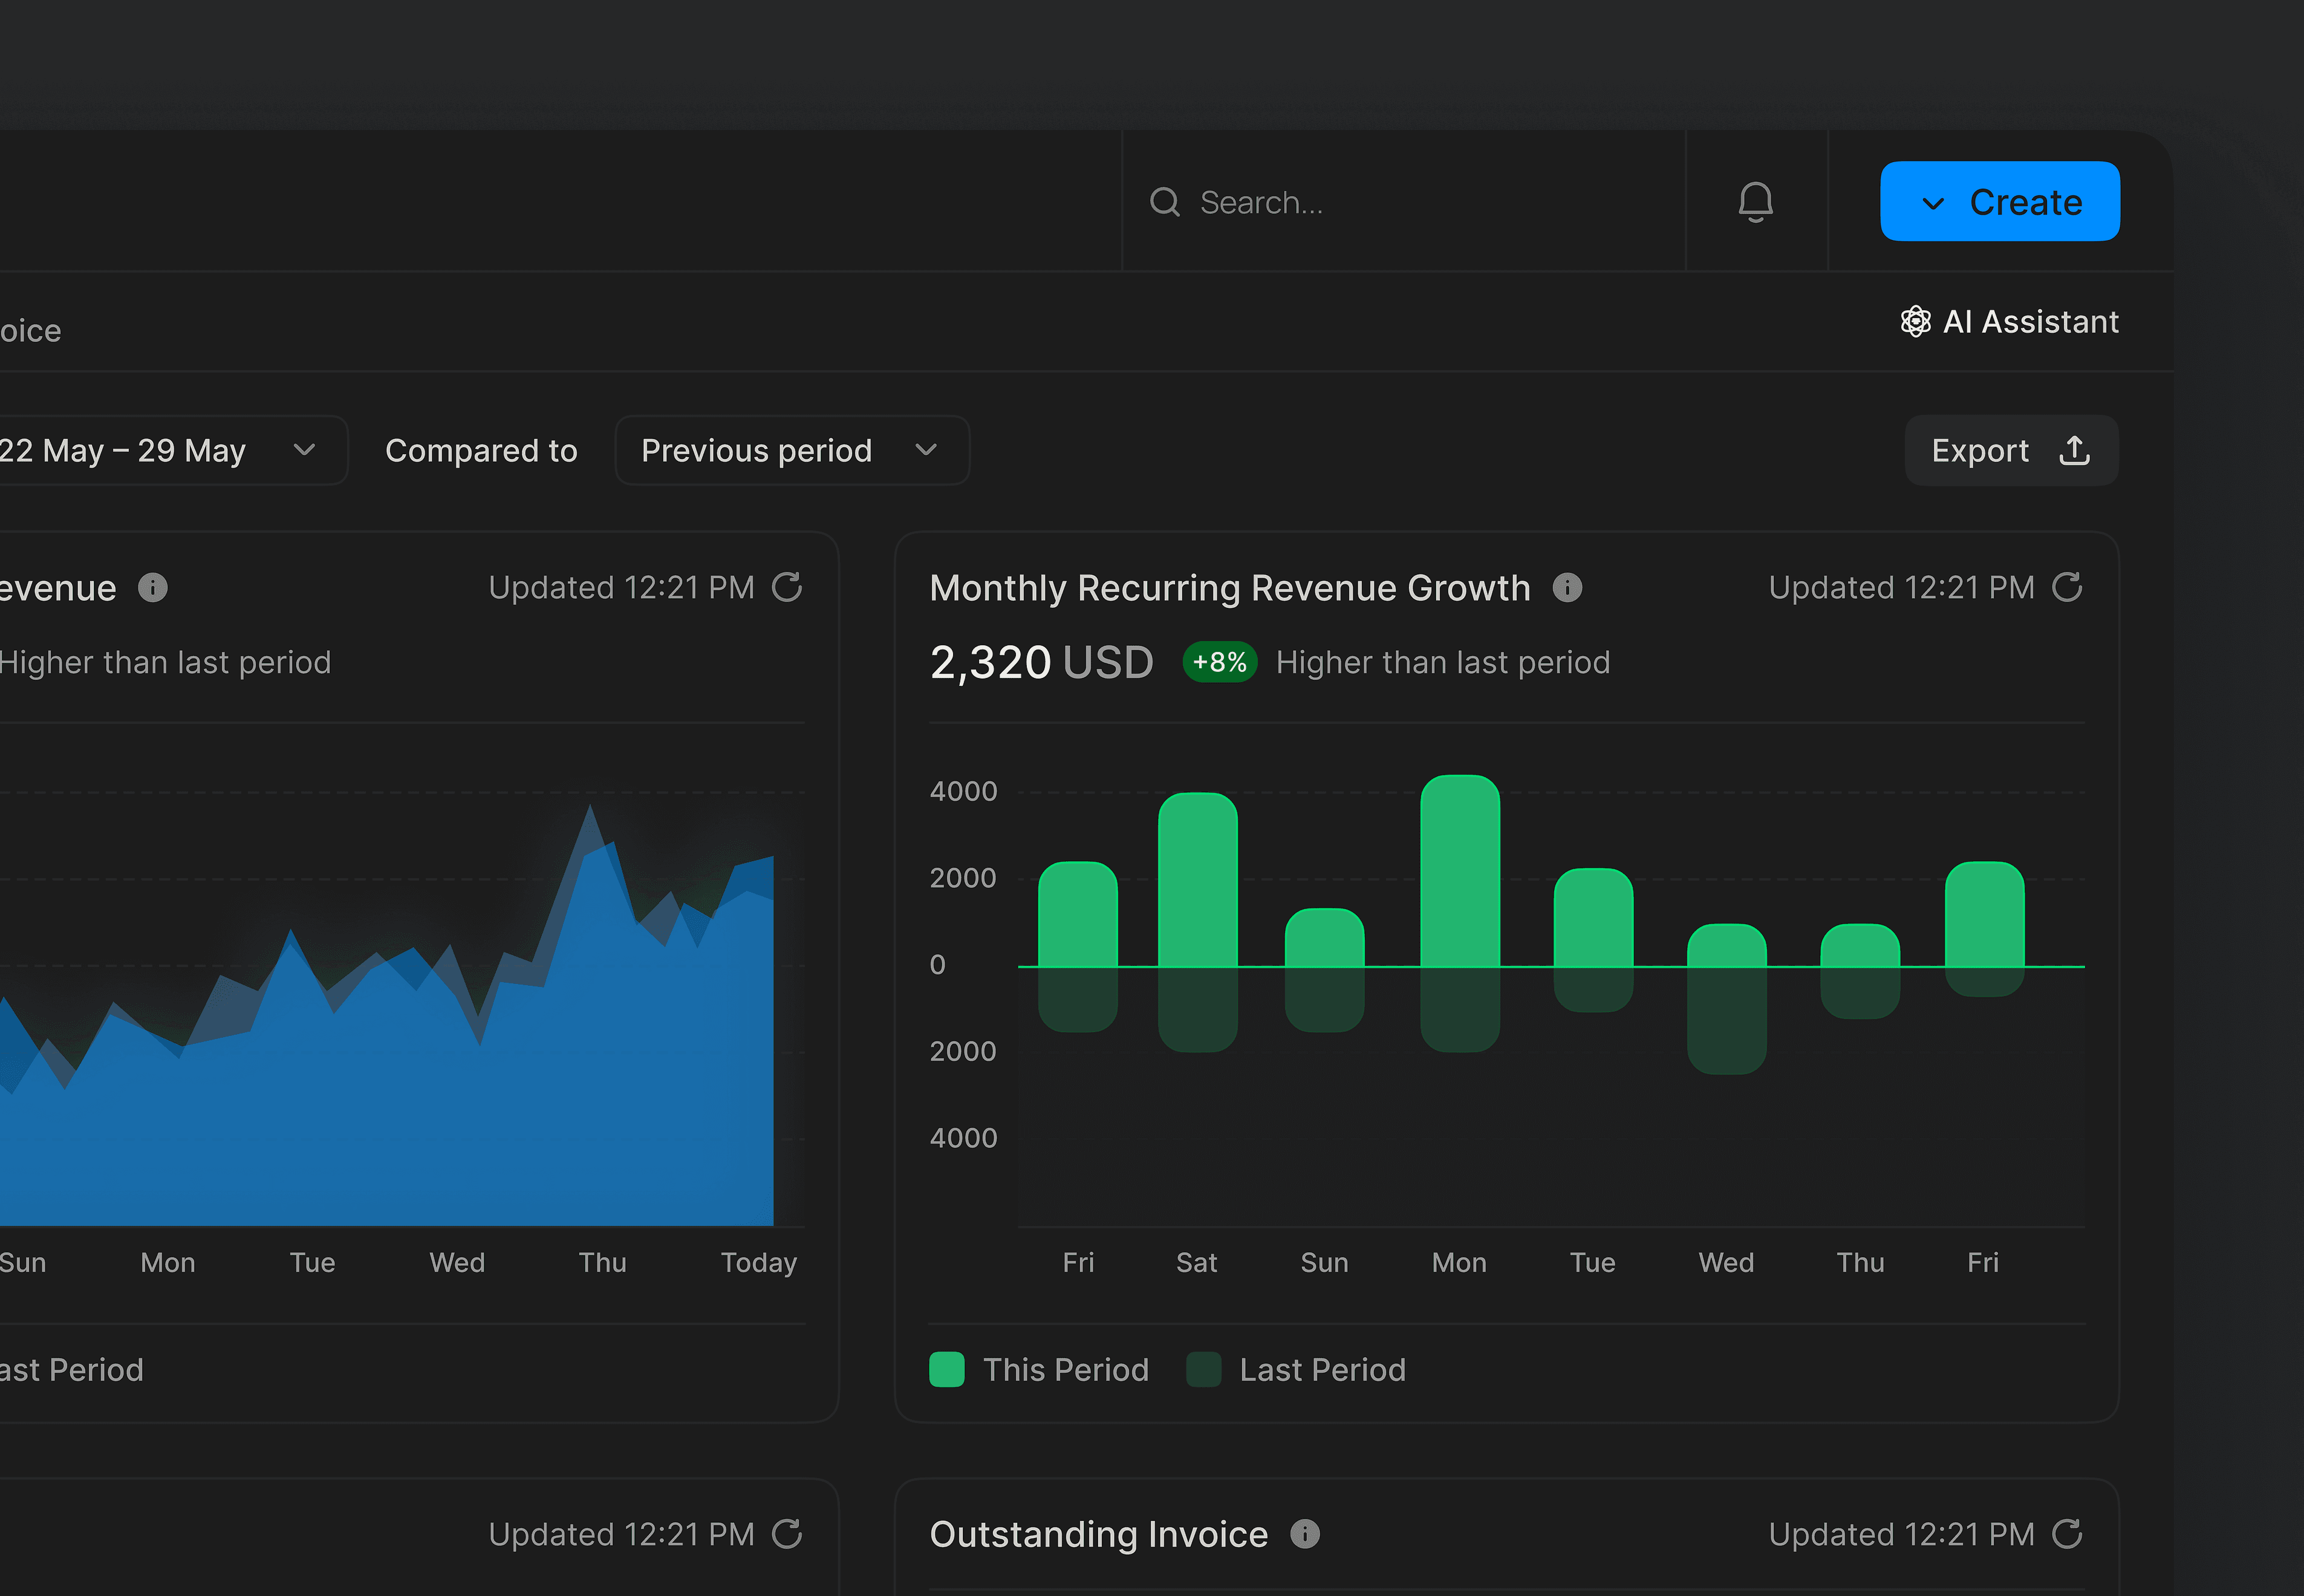
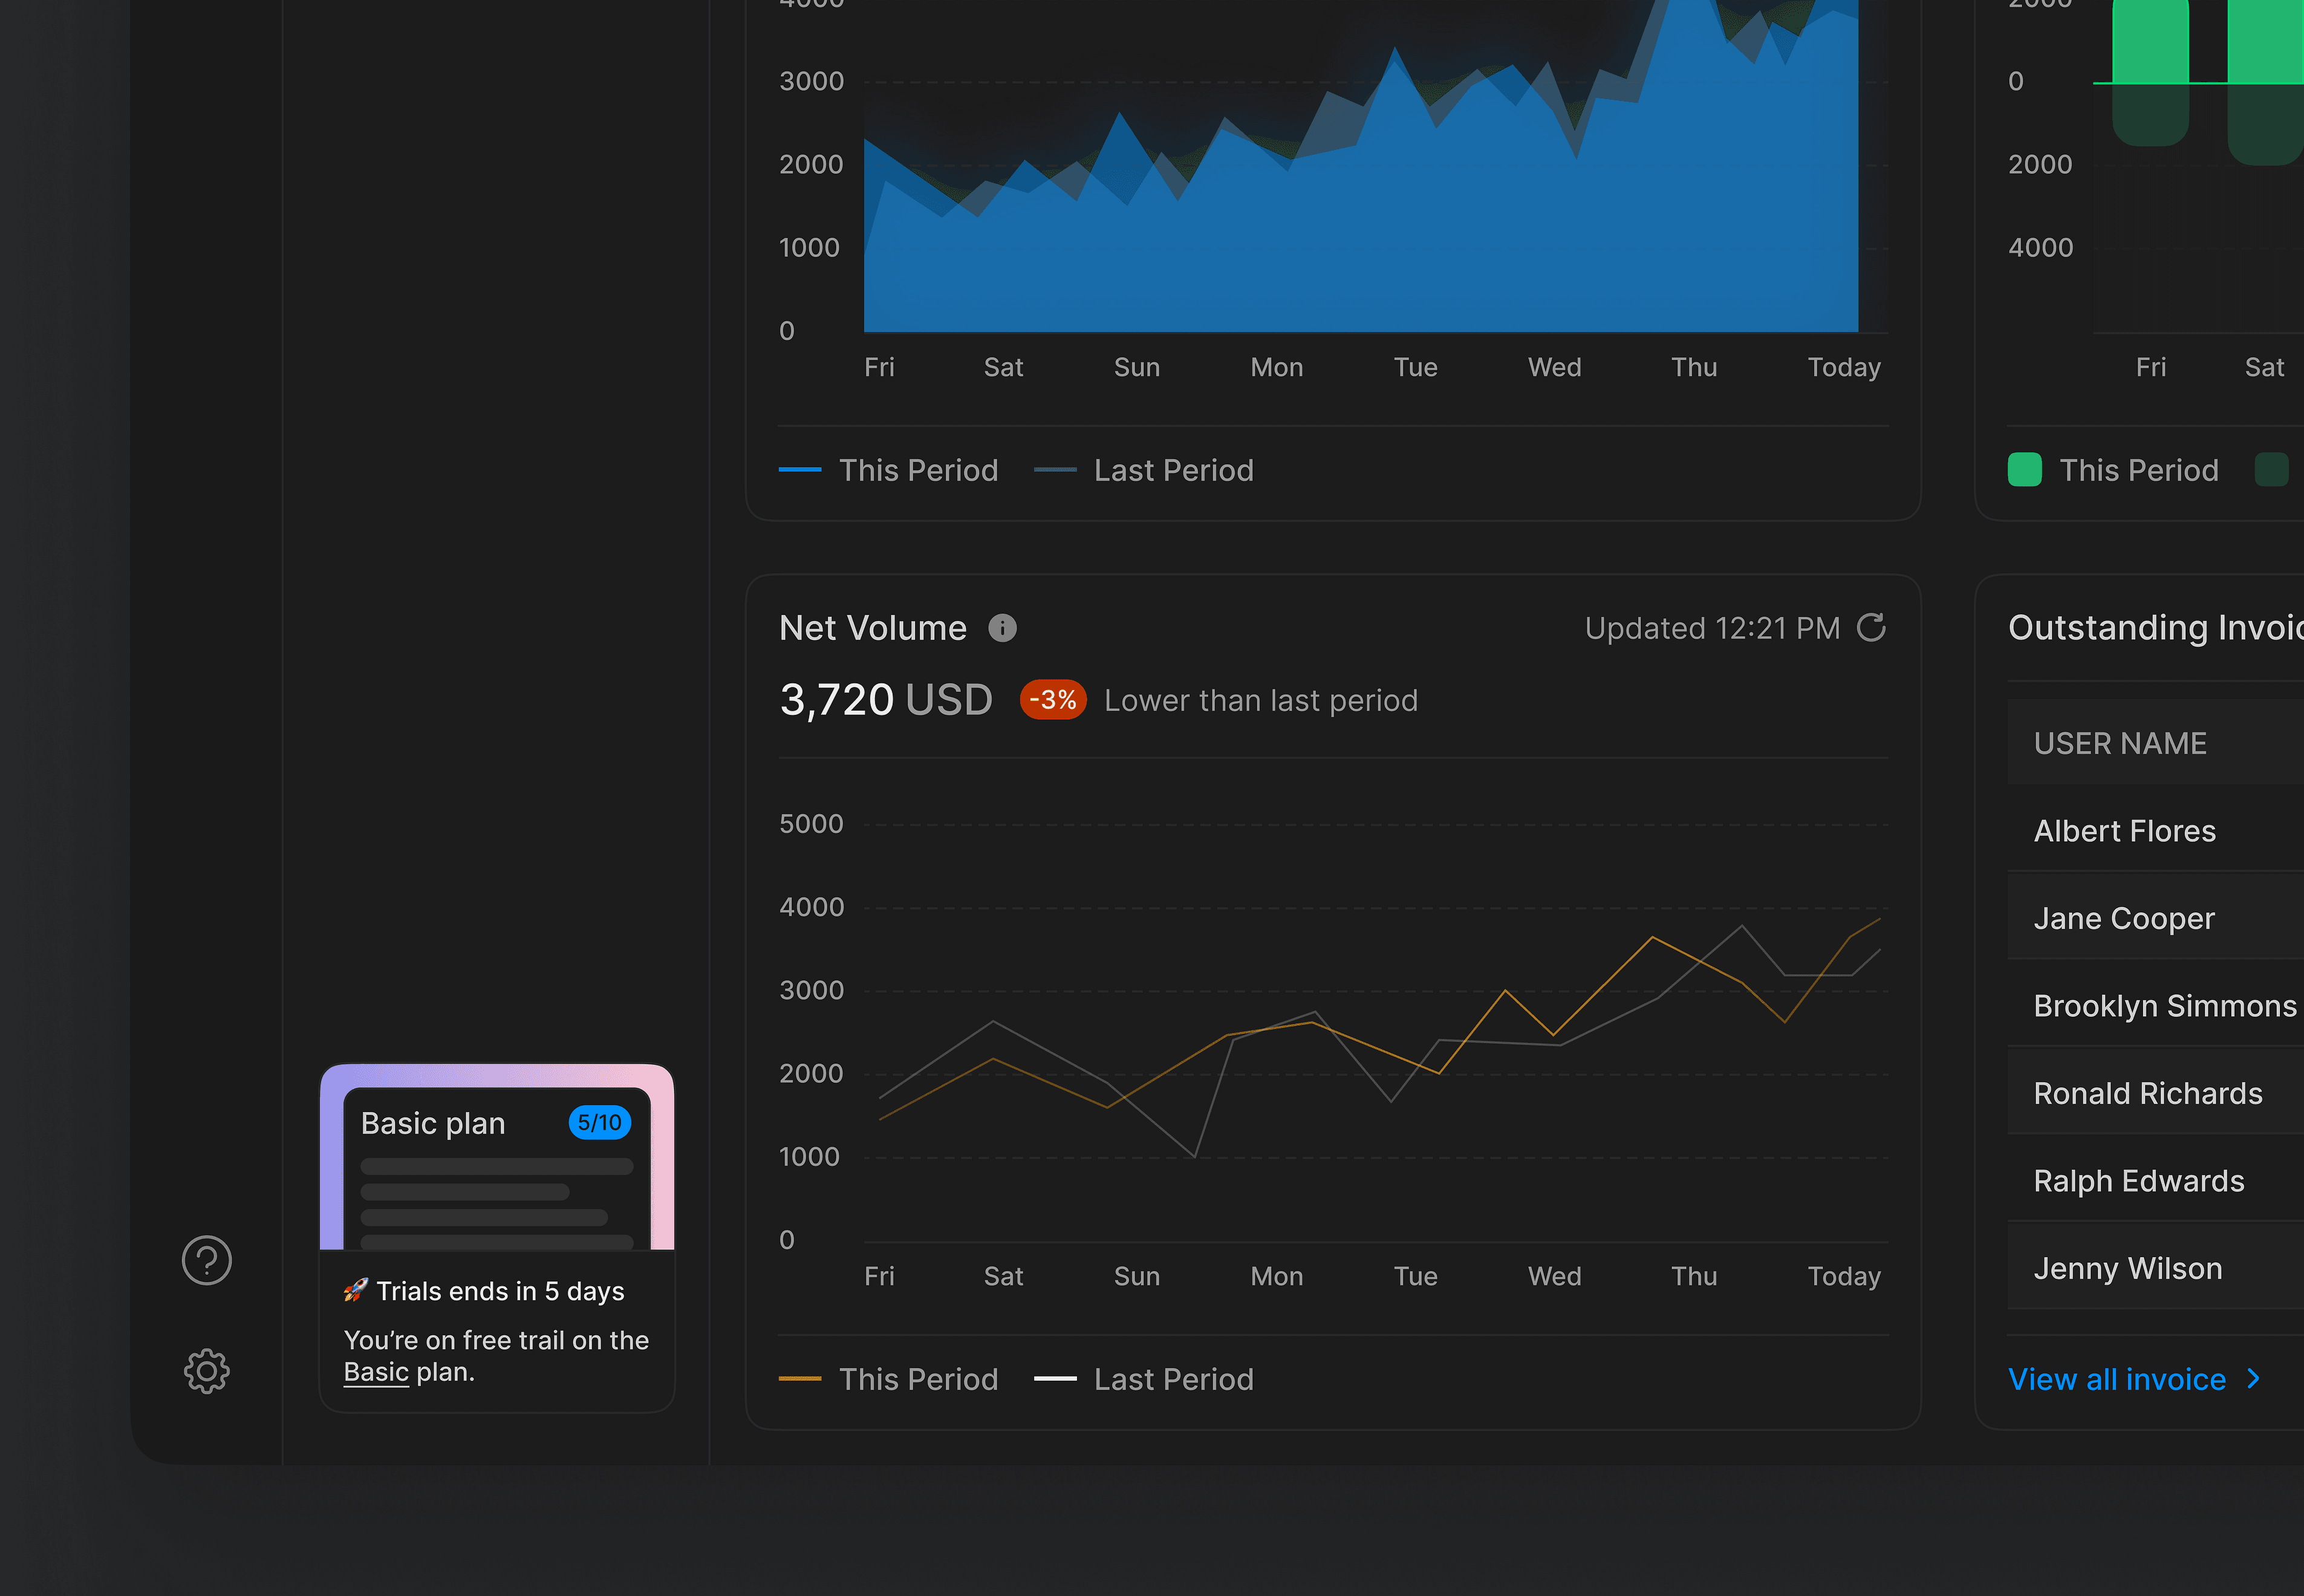
- Top-level MRR card (value, % growth, sparkline) and Net Volume trend chart with range selector + compare toggle.
- Interactive Outstanding Invoices table with expandable rows for user context and quick actions (remind, export, mark paid).
- Global time filters, instant incremental filtering, and linked drill-downs so charts and tables stay synchronized for fast analysis.